You're probably already doing pieces of business intelligence work without calling it that.
Maybe you export campaign results into Excel every Monday. Maybe your manager asks why churn increased, and you spend half a day combining numbers from three tabs just to give a rough answer. Maybe you're in operations, HR, sales, or marketing, and you know the data exists, but getting from raw numbers to a confident recommendation still feels slow, manual, and a little fragile.
That's exactly where business intelligence training becomes useful. Not because you need to become a full-time data engineer. Not because you need to turn into a heavy coder. But because modern teams need people who can turn messy business data into a dashboard, a pattern, and a decision.
If you come from a non-technical background, the good news is that BI is far more learnable than it looks. The best path isn't to memorize every feature in Power BI or Tableau. It's to learn how data moves, how metrics are defined, how dashboards answer real questions, and how AI tools can help you work faster from the beginning.
Why Business Intelligence Training Is a Smart Career Move
A lot of people hit the same ceiling in their careers. They can do the work, they understand the business, but they can't easily prove what's happening with data. That slows down promotions, limits influence in meetings, and keeps them stuck doing manual reporting instead of higher-value analysis.
Business intelligence training helps close that gap. It teaches you how to turn business questions into structured answers. Instead of saying, “I think this channel underperformed,” you can show which segment dropped, when it started, and what likely needs attention.
BI skills travel well across functions
This is one of the biggest reasons I recommend BI to non-technical professionals. These skills aren't locked to one department.
A marketer can use BI to compare campaign performance and budget allocation. An operations manager can spot process delays and service bottlenecks. An HR professional can track hiring funnel drop-off or survey trends. A sales leader can monitor pipeline movement and rep performance.
That portability matters because business problems change faster than job titles do.
Practical rule: Learn BI as a decision skill, not just a reporting skill.
There's also a market signal behind this. The global BI market was valued at US$29.42 billion in 2023 and is projected to reach US$54.27 billion by 2030, implying a 9.1% CAGR, according to G2's business intelligence statistics roundup. That doesn't guarantee any individual job. It does show sustained demand for people who can interpret metrics and support data-driven decisions.
Why this matters if you feel “non-technical”
The mistake many beginners make is assuming BI belongs only to analysts with computer science backgrounds. In practice, some of the strongest BI professionals started in business roles and learned the technical layer second.
That background can help. If you already understand how a funnel works, how teams report results, or what stakeholders ask in meetings, you're not starting from zero. You already know the business side of the problem. Business intelligence training gives you the method for answering it cleanly.
Here's the shift that matters most:
- From gut feel to evidence
- From spreadsheet cleanup to repeatable reporting
- From reacting to requests to shaping decisions
That's a strong career move in almost any modern office.
Understanding Business Intelligence and What It Is Not
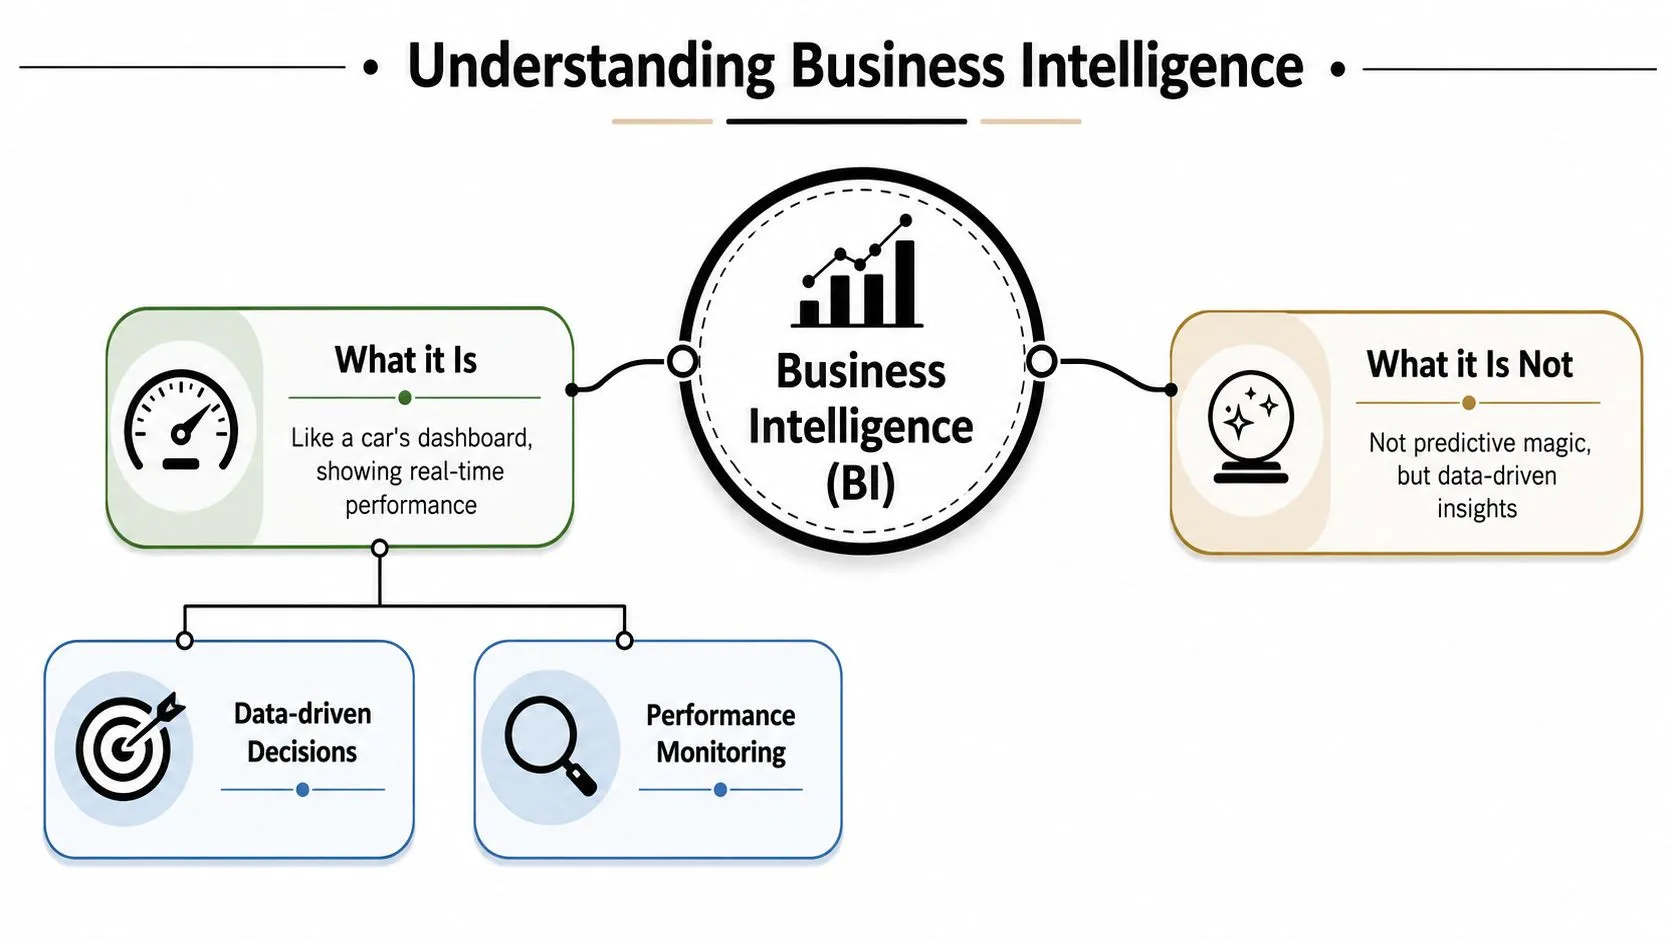
Business intelligence is easiest to understand if you stop thinking about it as “data work” and start thinking about it as a business dashboard system.
A car dashboard doesn't show you every detail inside the engine. It shows the signals you need to drive well: speed, fuel, warnings, direction. BI does the same thing for a company. It turns a lot of hidden operational data into visible signals that help people act.
What BI actually does
At its best, BI helps teams answer questions like these:
- What changed: Did sales drop, did support volume spike, did conversion slow down
- Where it changed: Which region, product, team, or customer segment moved
- When it changed: Was this a one-week dip or a longer trend
- What needs attention: Which issue deserves action first
That's why BI is so useful for working professionals. It's not abstract. It's tied directly to recurring business tasks like weekly reports, monthly reviews, KPI tracking, and performance discussions.
What BI is not
BI is not magic forecasting. It's not a replacement for strategy. And it's not the same thing as data science.
A simple way to separate them:
| Area | Main focus | Typical output |
|---|---|---|
| Business intelligence | Understanding current and past performance | Dashboards, reports, KPI analysis |
| Data science | Building predictive or experimental models | Forecasts, models, advanced analysis |
There's overlap, but the day-to-day job is different. BI usually asks, “What happened, and what should the team do now?” Data science often asks, “What is likely to happen next, and can we model it?”
For most non-technical professionals, BI is the better starting point because it connects faster to real business workflows.
Why the full pipeline matters
Many beginners think BI means learning one dashboard tool. That's too narrow. Effective business intelligence training teaches the full BI pipeline: collection, transformation, modeling, visualization, and reporting, as described in Coursera's BI Analyst certificate overview.
That matters because dashboards only look simple at the end. Underneath them, someone has to pull data from source systems, clean it, structure it, define metrics, and check that the numbers mean what stakeholders think they mean.
I usually explain data modeling like organizing a kitchen. If ingredients are stored randomly, cooking takes longer and mistakes happen. If everything is labeled, grouped, and easy to reach, meals come together faster. A good data model does that for analysis. It makes the numbers easier to trust and easier to use.
If a course teaches chart colors but skips data models and pipelines, it's teaching the paint, not the plumbing.
That's the difference between learning to decorate a dashboard and learning to do BI work.
The Core Skills and Tools You Need to Master
Individuals often overestimate how many tools they need and underestimate how important the fundamentals are.
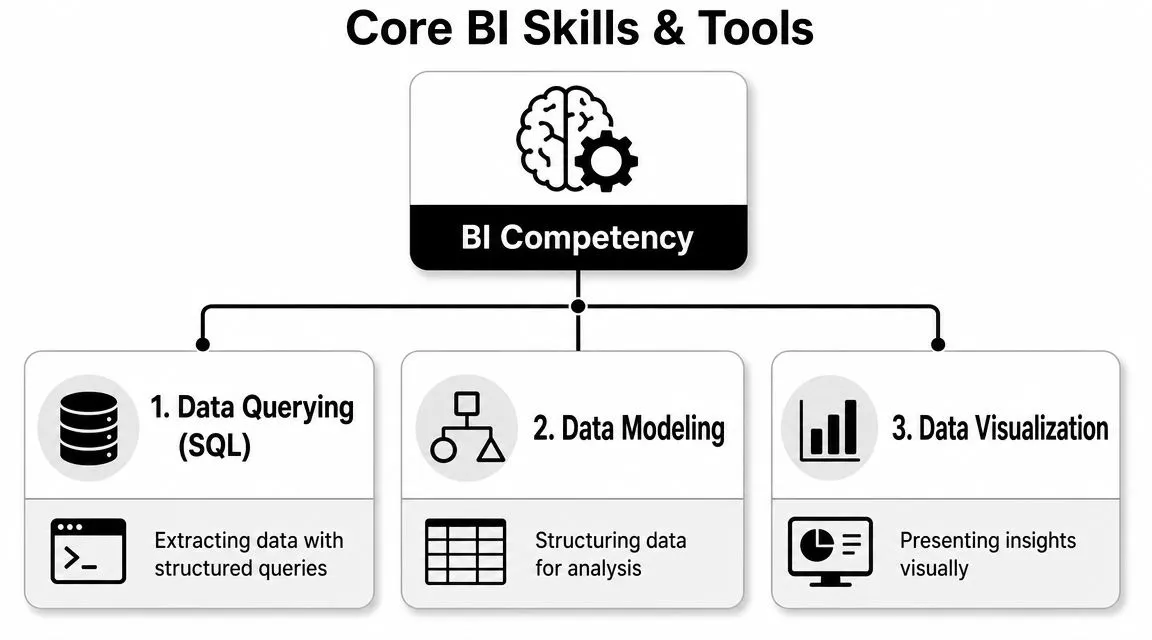
You do not need to master every analytics platform. You do need a working grasp of a few core skills that show up again and again, no matter whether you use Power BI, Tableau, Looker Studio, or Excel.
SQL is how you ask data better questions
SQL scares beginners because it looks like code. In practice, it's closer to a precise way of asking for information.
You use SQL to filter records, join tables, group results, and calculate metrics. That translates directly into job tasks like finding repeat customers, comparing monthly performance, or pulling a clean list for a stakeholder review.
If you're non-technical, don't treat SQL as software engineering. Treat it as structured business questioning.
A good beginner sequence looks like this:
- Start with filtering: Learn
SELECT,WHERE, andORDER BY - Move to grouping: Use
GROUP BYfor counts, sums, and averages - Then learn joins: Connect customer, order, or campaign tables
- Use AI carefully: Ask ChatGPT or Claude to draft a query, then validate the logic yourself
Data modeling is what makes dashboards trustworthy
This is the most overlooked BI skill.
If SQL gets the data, data modeling makes sure the numbers stay consistent. It defines relationships between tables, standardizes metrics, and prevents different departments from calculating the same KPI in different ways.
For junior analysts, this often feels abstract until they see the pain of bad modeling. One dashboard says revenue one way, another says it differently, and nobody trusts either. That isn't a visualization problem. It's a modeling problem.
Visualization is about clarity, not decoration
A strong BI dashboard answers a business question fast. It doesn't try to impress people with every chart type in the software.
Good visualization work usually means:
- choosing the right chart for the question
- highlighting the KPI that matters
- reducing clutter
- making comparisons obvious
- labeling clearly enough that a manager doesn't need narration
If you want to get faster at that specific skill, this short course on visualizing data in minutes is useful as a practical supplement to a broader BI path.
Here's a quick explainer that helps many beginners connect the pieces:
Tools matter, but less than you think
Tools are the vehicle, not the skill.
Here's how I'd frame the common ones:
| Tool | Best thought of as | Where it helps |
|---|---|---|
| Power BI | Strong business dashboard platform | Microsoft-heavy workplaces |
| Tableau | Flexible visual analysis tool | Teams that care deeply about visual exploration |
| Excel | Fast analysis scratchpad | Early cleanup, quick checks, small reporting tasks |
| SQL editor | Data access workspace | Pulling and shaping raw data |
Learn one dashboard tool well enough to build and explain a report. Spend the rest of your time learning how metrics, models, and business questions fit together.
That mix makes your BI skills portable.
A Step-by-Step BI Learning Path for Beginners
A beginner usually hits the same wall around week three. They can follow a dashboard tutorial while the video is on, but when a manager asks, "Why did conversions drop last month?" they are not sure where to start. That gap is not a motivation problem. It is a sequence problem.
A good BI learning path builds the same way real work happens. You start with the business question, get comfortable with the data behind it, then learn the tools that help you answer it faster and explain it clearly. That is also why I would not treat BI as a purely technical track anymore. For non-technical roles, the modern advantage comes from learning the foundations and using AI early to speed up drafting, checking, and documenting your work.
Google structures its BI certificate from foundational concepts into data models, pipelines, dashboards, and reports on Google's Business Intelligence Certificate page. That order makes sense because each layer supports the next.
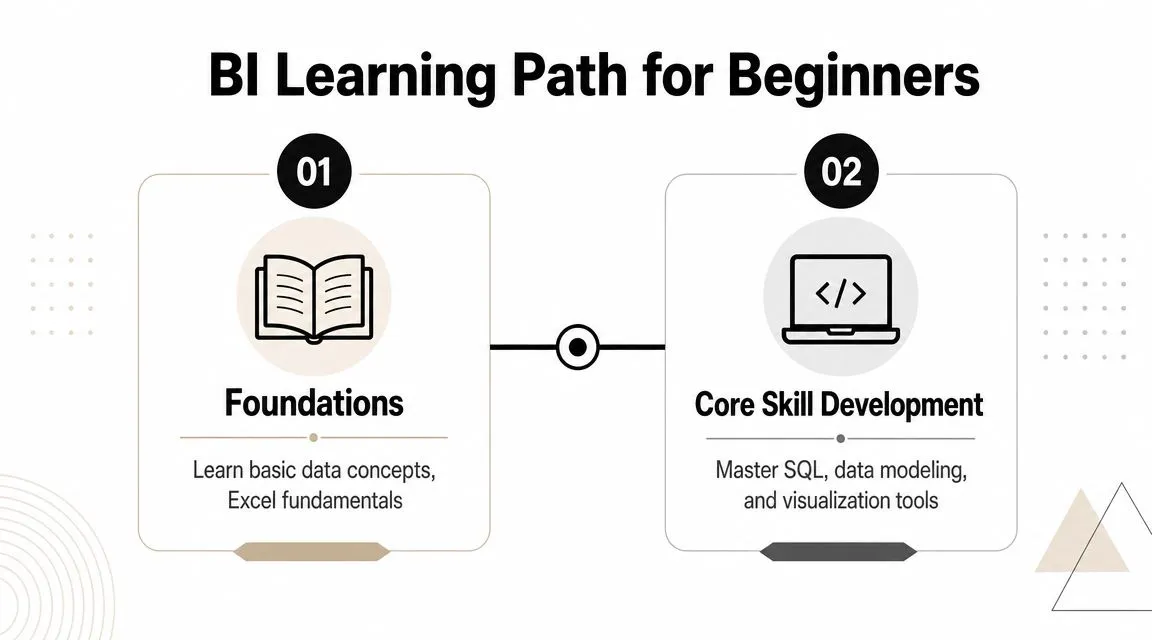
Phase 1 builds your business and data foundation
Start with the questions companies already ask every week.
Revenue. Retention. Conversion. Cost per lead. On-time delivery. Support backlog. If those terms feel familiar from marketing, operations, sales, or customer success, that is useful. BI work begins by translating those business questions into data you can check.
This first phase is less about software and more about judgment. Learn what rows, columns, tables, metrics, and KPIs mean in practice. Get used to spotting duplicate records, missing values, broken date formats, and totals that do not match. A junior analyst who can catch those problems early saves a team real time.
Focus on:
- Business questions: what decision needs to be made, and what metric supports it
- Data basics: tables, filters, duplicates, blanks, date fields, inconsistent labels
- Reporting habits: which KPIs are useful, which ones create noise, and what a stakeholder needs to see first
If you want to build AI skills alongside BI from the beginning, this guide on learning AI for business roles fits well here. It helps non-technical professionals use AI as a work assistant instead of treating it like a separate specialty.
Phase 2 develops your core BI mechanics
Now the work gets more hands-on. Learn SQL, basic data modeling, and one dashboard tool at the same time.
That combination matters because the skills reinforce each other. A query teaches you what the raw data looks like. A data model teaches you how tables connect. A dashboard forces you to decide which metric definition is going to be shown to a manager. Data modeling works like a floor plan for a building. If the rooms connect poorly, people get lost. If tables connect poorly, reports break, totals drift, and trust disappears.
For beginners from non-technical roles, SQL does not need to start as a programming identity. It starts as question answering. Can you filter a date range, group results by channel, and compare this month to last month? That is already useful on the job.
AI can speed this phase up if you use it carefully. Ask it to explain the difference between a left join and an inner join in plain language. Ask it for a draft SQL query, then test every line. Ask it to rewrite a dashboard title so a sales director can understand it in five seconds. The point is not to outsource thinking. The point is to shorten the path from blank page to first draft.
Phase 3 turns training into proof
This phase separates people who studied BI from people who can do BI work.
Employers want to see that you can move from a messy question to a usable answer. That means taking a small business problem, checking the data, building a simple analysis, and writing a recommendation. One compact project with a clear explanation usually carries more weight than a folder full of half-finished exercises.
Career changers often have an advantage. Someone from operations already understands delays, handoffs, and service levels. Someone from marketing already understands campaign performance and channel reporting. Use that context. It makes your analysis more realistic and your portfolio more credible.
A practical 12-week curriculum
A short, disciplined plan works well for busy professionals because it keeps each week tied to a job task. The goal is steady output, not endless studying.
Here is a realistic sample plan:
| Week | Focus Area | Key Topics & Tasks |
|---|---|---|
| 1 | BI foundations | Learn core BI terms, common business questions, KPI definitions, reporting basics |
| 2 | Spreadsheet cleanup | Practice filters, lookups, pivots, date cleanup, duplicate checks |
| 3 | SQL basics | Write simple queries to select, filter, sort, and review raw records |
| 4 | SQL aggregation | Calculate sums, averages, counts, and answer basic business questions |
| 5 | SQL joins | Combine tables such as customers, orders, and products, then check for mismatches |
| 6 | Data modeling basics | Learn table relationships, grain, dimensions, facts, and metric consistency |
| 7 | Dashboard tool setup | Load data into Power BI or Tableau and build a first working report |
| 8 | Chart design | Create KPI cards, trend views, comparison charts, and cleaner layouts |
| 9 | Business communication | Write findings in plain language and tie them to a decision or action |
| 10 | AI-assisted workflow | Use AI to draft queries, summarize patterns, review formulas, and improve report copy |
| 11 | Project build | Create one end-to-end dashboard with notes on the business question, method, and recommendation |
| 12 | Portfolio polish | Document the project, publish screenshots, and write resume bullets tied to outcomes |
Use one rule each week: learn one concept, practice one task, ship one small output.
That rhythm builds confidence faster than collecting tutorials. It also mirrors a BI job. Analysts rarely get rewarded for knowing a little bit of everything. They get rewarded for producing a useful answer on time.
Building Your Portfolio with Hands-on BI Projects
Hiring managers don't want to guess whether you can use BI effectively in practice. They want evidence.
The strongest beginner portfolios don't try to look massive. They show that you can take a practical business question, work through the data, and communicate a recommendation. That's especially important because a major gap in BI education is helping non-technical professionals turn skills into usable output for roles like marketing and operations, as reflected in Coursera's business intelligence course listings.
Project idea one for marketing reporting
A strong first project is a campaign performance dashboard.
Use public marketing or ad-style data if you have it, or sample sales and traffic data if you don't. Frame the project around a question like: Which campaigns or channels deserve more budget attention?
Show:
- the source data
- a cleaned table
- key metrics such as leads, conversions, or cost categories
- a dashboard with trend and comparison views
- a short recommendation memo
If you want a project prompt to model this kind of work, this course on extracting insights from sales data can help you practice turning numbers into decisions.
Project idea two for operations or service teams
Build a process bottleneck report.
Use data with dates, statuses, owners, and completion times. Your goal is to identify where work slows down. This project works well for operations, customer support, and project coordination backgrounds because it mirrors real reporting tasks.
A hiring manager can immediately see the value: you're not just charting activity. You're helping a team reduce delays.
A portfolio project becomes stronger the moment it answers, “What should the business do next?”
Project idea three for HR or people teams
Create an employee survey or hiring funnel dashboard.
You might analyze application stages, time-to-review patterns, or survey themes by department. Keep the design simple and respectful. The point is to show that you can segment responses, track movement through a process, and surface a clear takeaway for leadership.
Project idea four for managers moving into analytics
Build an executive KPI summary for a fictional business unit.
This project is powerful for career changers because it showcases judgment. Choose a handful of metrics, define them clearly, build a compact dashboard, and write a one-page summary explaining what changed and what action you'd recommend.
That last piece matters. Plenty of beginners can build charts. Fewer can make those charts useful in a meeting.
Certifications, Careers, and Speeding Up Workflows with AI
A certification can help, but only if you understand what it's for.
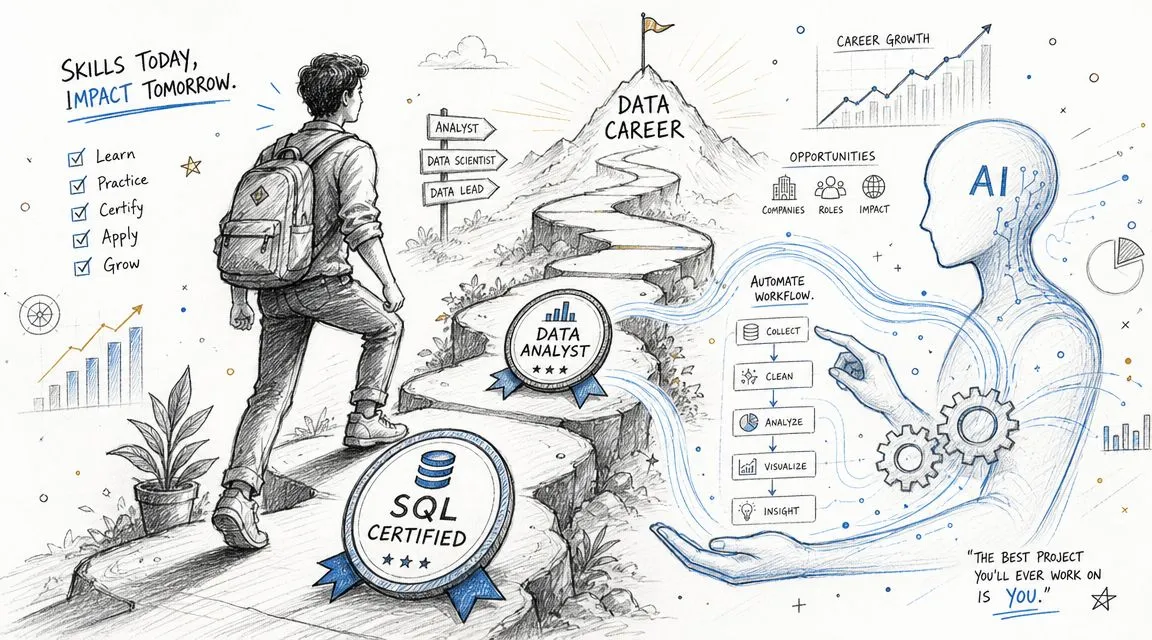
It's useful as a structure, a signal, or a forcing function. It's not a substitute for actual BI work. If you earn a certificate but can't explain a dashboard, write a clean SQL query, or define a metric properly, employers will notice quickly.
Which credentials are worth considering
For most beginners, there are two sensible certification paths:
- Platform-specific certificates for tools like Power BI or Tableau
- Broader BI programs that combine SQL, modeling, dashboards, and reporting
The right choice depends on your goal. If your workplace already uses Microsoft tools, a Power BI-focused path can be practical. If you need a fuller reset because you're moving from marketing, operations, or HR into analytics, a broader certificate often gives you better structure.
Career paths that grow naturally from BI skills
BI doesn't lock you into one title. That's one of its strengths.
Common next steps include:
| Starting point | BI-supported move |
|---|---|
| Marketing coordinator | Marketing analyst or growth analyst |
| Operations specialist | Operations analyst or business analyst |
| HR generalist | People analyst or workforce reporting role |
| Account or sales support | Revenue analyst or sales operations role |
There's also a middle path many people miss. You don't have to become a “pure analyst” to benefit. Plenty of professionals use BI to become the most data-capable person on a business team. That alone can change your trajectory.
AI is a force multiplier if you use it correctly
Modern business intelligence training should be more practical than older programs.
AI tools can help you:
- draft SQL queries from plain-English questions
- explain what a join is doing
- suggest cleaner KPI names
- summarize dashboard findings for executives
- brainstorm chart layouts
- rewrite a dense report into a clearer business recommendation
The key is knowing what to delegate and what to verify.
Use AI for speed on first drafts. Don't outsource judgment. If a model gives you a query, check the joins. If it writes an executive summary, confirm the underlying numbers. If it suggests a chart, ask whether that chart answers the question.
That's why AI literacy now belongs inside BI training, especially for non-technical learners. It lowers friction without removing the need to think.
For a broader view of how AI can support practical workplace learning, this guide on learning AI for business is a useful companion.
The modern BI professional isn't the person who avoids AI. It's the person who uses AI to move faster without lowering standards.
Your Business Intelligence Training Questions Answered
Do I need a technical degree to learn BI
A technical degree is not the entry ticket.
People coming from operations, customer support, finance, recruiting, or marketing often have an advantage early on because they already know how work happens. They understand messy requests, unclear definitions, and stakeholders who ask for one metric when they really need another. BI training helps you add structure to that instinct.
Start in layers. Learn spreadsheet logic first. Then learn basic SQL, simple data models, and dashboard design. AI tools can speed up the early learning curve by helping you draft queries, explain formulas, and translate business questions into analysis steps. The job still requires judgment, but the path is far less code-heavy than many beginners assume.
How long does it take to become useful at BI
Usefulness comes before confidence for almost everyone.
A beginner becomes valuable once they can take a business question, find the right data, clean obvious issues, build a clear chart or dashboard, and explain what action the team should take next. That is real BI work. It does not require expert-level SQL or advanced statistics.
For busy professionals, shorter, project-based training usually works better than a long theory-first approach. I usually tell new analysts to measure progress by tasks, not by weeks. If you can answer questions like "Why did renewals drop in March?" or "Which lead source is producing qualified pipeline?" with a repeatable process, you are already contributing at a professional level.
How much should I spend on business intelligence training
Spend based on outcomes, not branding.
A lower-cost course can be a good choice if it teaches the full workflow: framing the question, cleaning data, writing basic SQL, building a dashboard, and presenting a recommendation. A high-priced program can still disappoint if it focuses on tool screens without teaching how analysts make decisions.
Before paying, check for three things. First, you need practice with realistic business datasets. Second, you need projects you can show in a portfolio. Third, you need some exposure to AI-assisted workflows, because modern BI work often includes using AI to draft queries, summarize findings, or speed up documentation. That combination is what helps non-technical learners get job-ready faster.
If you want to build AI-assisted BI skills faster, AI Academy is a practical place to start. It's designed for non-technical professionals who want short, actionable lessons on ChatGPT, Claude, Perplexity, automation, and real workplace workflows, so you can speed up reporting, analysis, and decision support without getting buried in theory.